Forensics generates a report with a single chart and a single data grid
Forensics allows multi-measurements, Bytes/bps/Packets/Flows/TCP Flags etc in the data grid, Some frequently used Forensics report are available in the left and right-click menus.
The chart allows a double-click on a chart item to drilldown or right-click on a chart item to launch the drilldown popup menu.
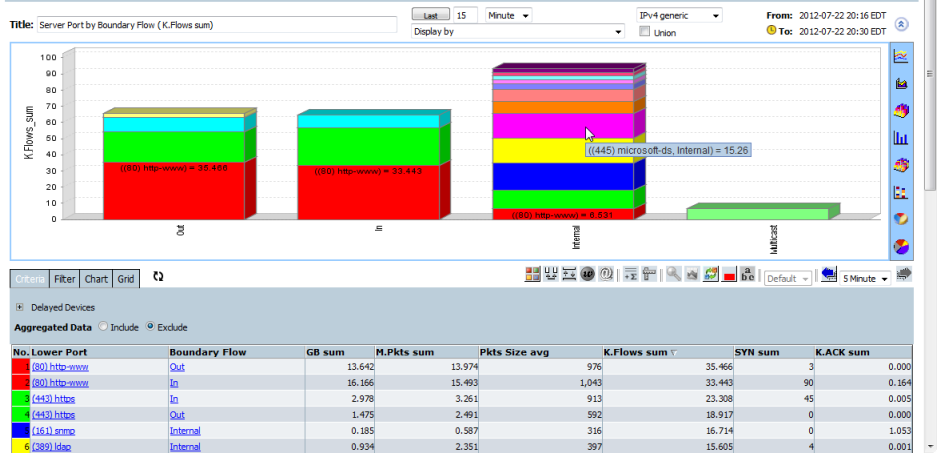
The Criteria will be inherited from the chart item selected.
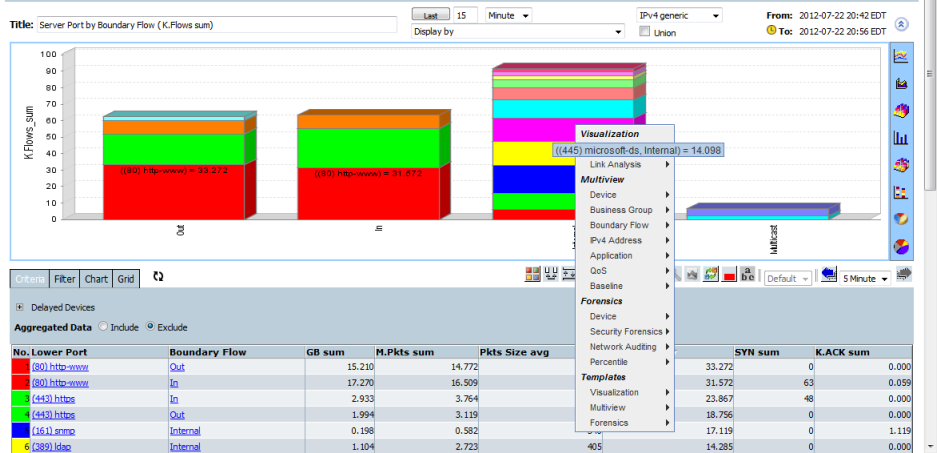
A chart Item can be right-clicked to reveal the popup menu and change to a selected perspective whilst inheriting the selected criteria.
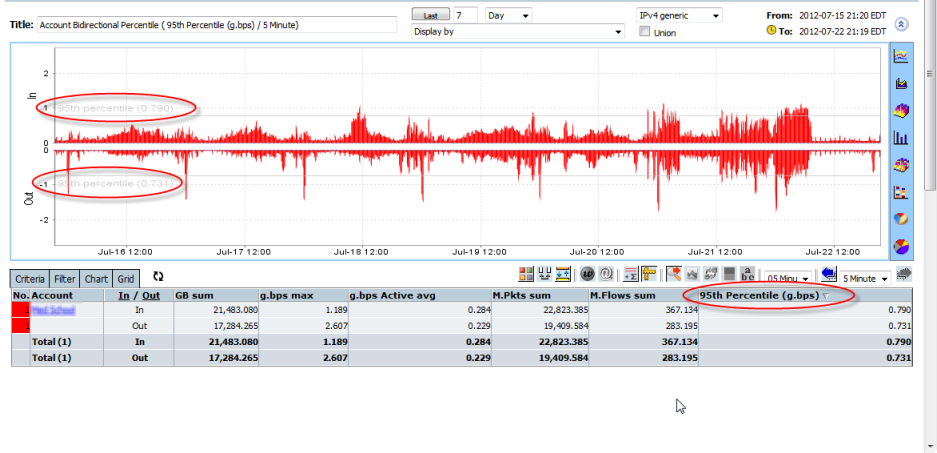
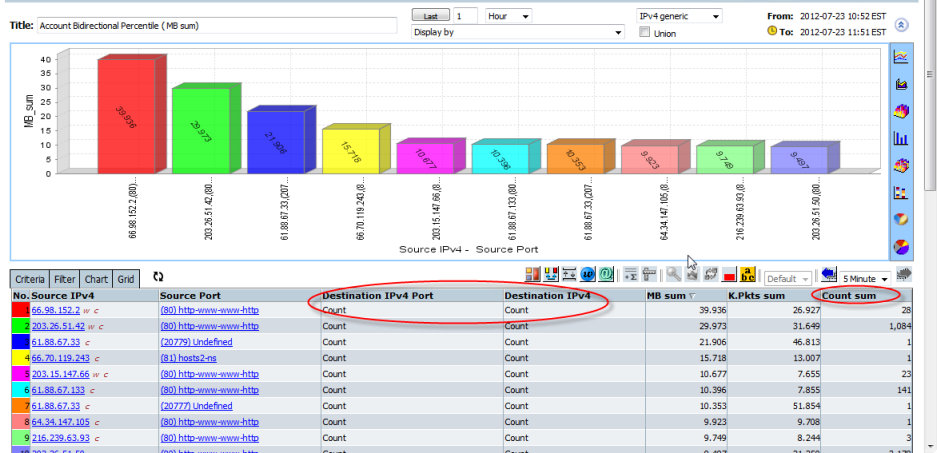
Forensics generates percentile reports
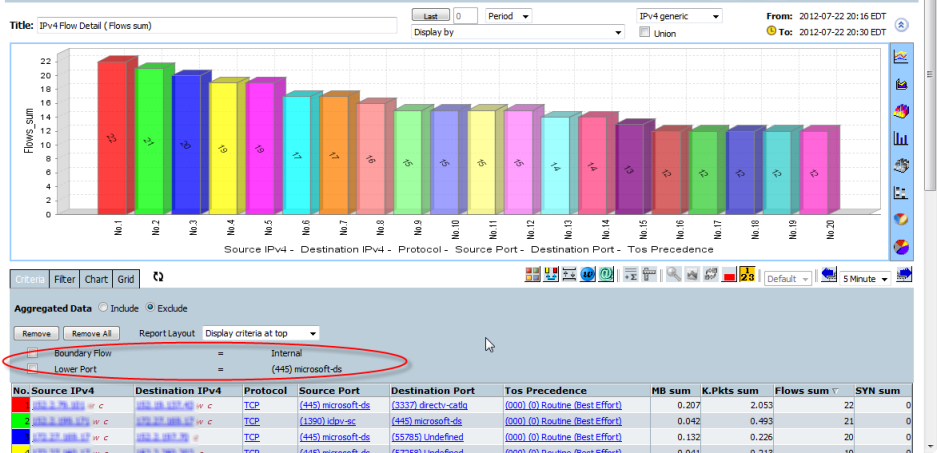
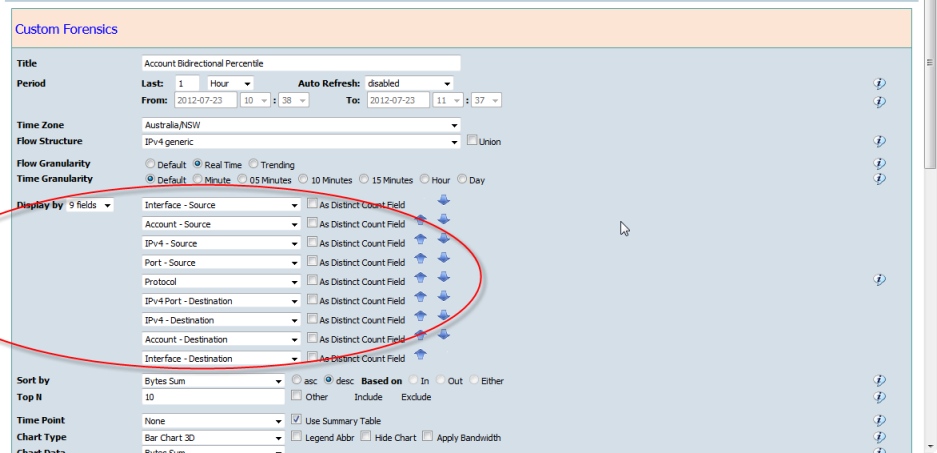
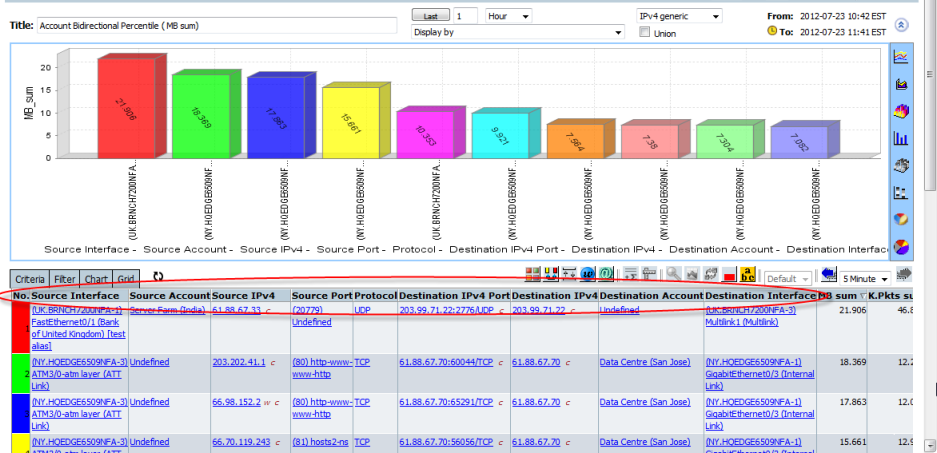
Forensics allows an extended combination of netflow raw fields or correlated fields. This makes this view of the data far more granular than any other method.
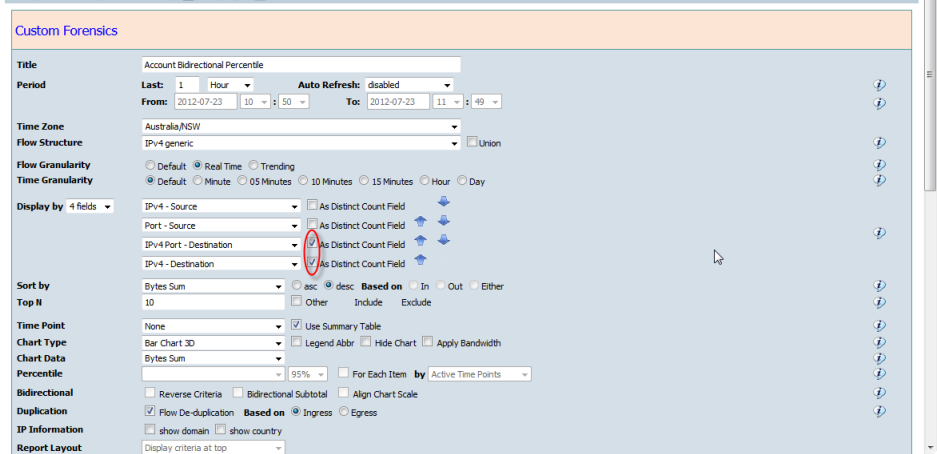
Forensics provides the ability to count Dimensions in the report. Count analytics Counts records as part of a result to quickly identify excessive flows or change. Any record combination can be counted, e.g. counting all internal IP's with number of IP or Port conversations enables quick identification of Port Scanners, P2P users, DDoS attacks or other multi threaded conversations. Identify long lasting flows or conversations.
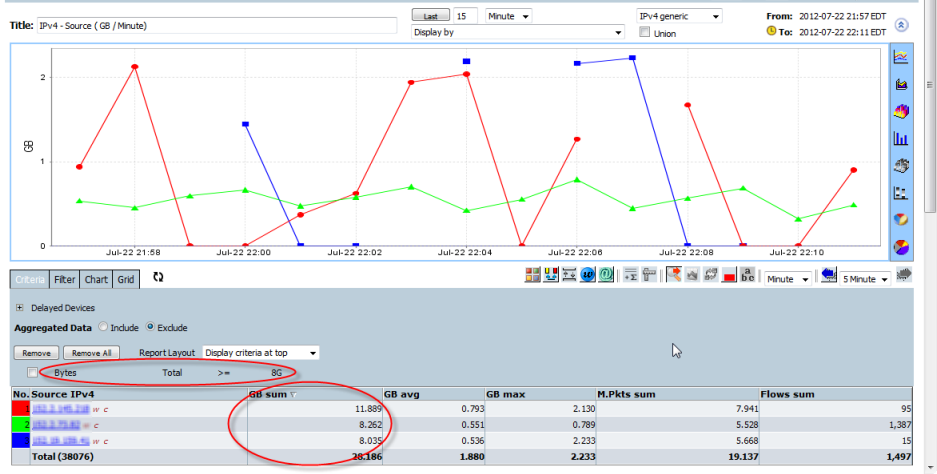
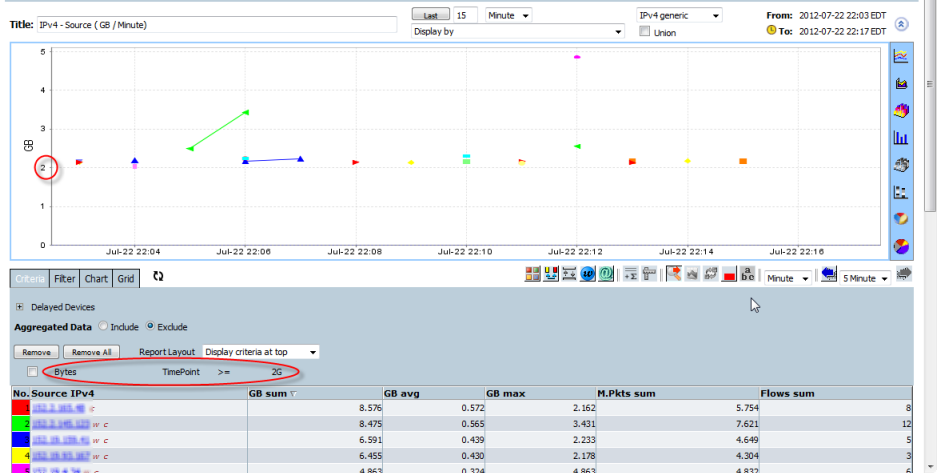
Forensics allows the measurement of Bytes/bps/Packets/pps/flows/TCP Flags etc and Period Total value or Time Point values to be used as part of the search criteria

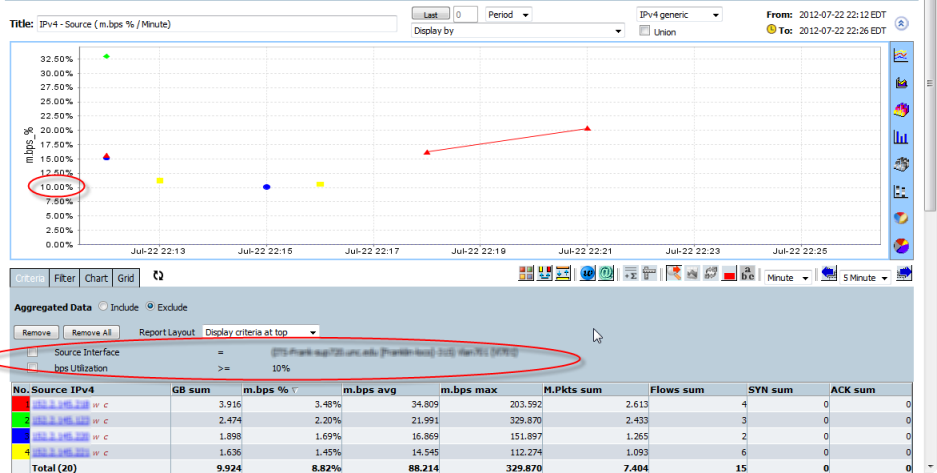
"bps_Utilization" (percentage against bandwidth) is allowed to be used as a criteria when "Bandwidth" is available in the report definition.e.g. Interface in "Display by" fields.
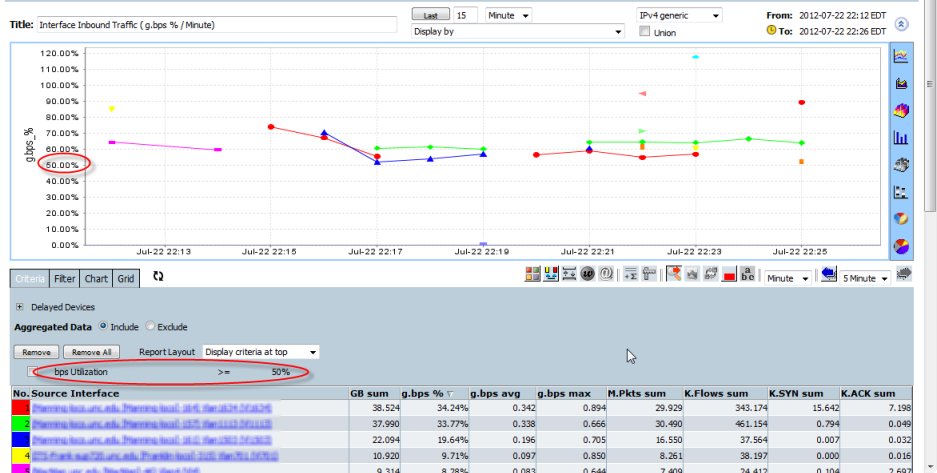
e.g. Interface in criteria.
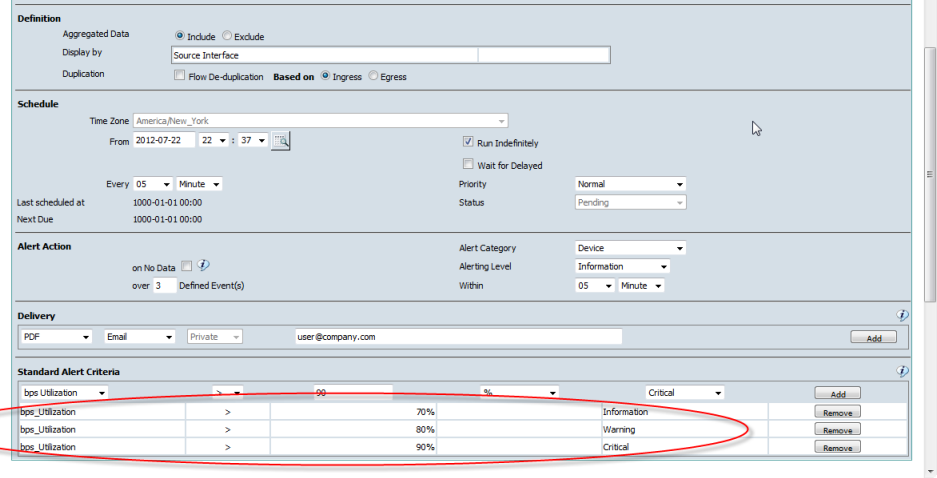
Forensics can be save as a Threshold Alert or a Baseline Alert.
When Forensics report is saved as a Alert, the measurement criteria must be defined in "Report Edit" screen.e.g. Threshold Alert on any interface inbound traffic over 70%, 80% and 90% bandwidth utilization.
e.g. Baseline Alert on ICMP traffic
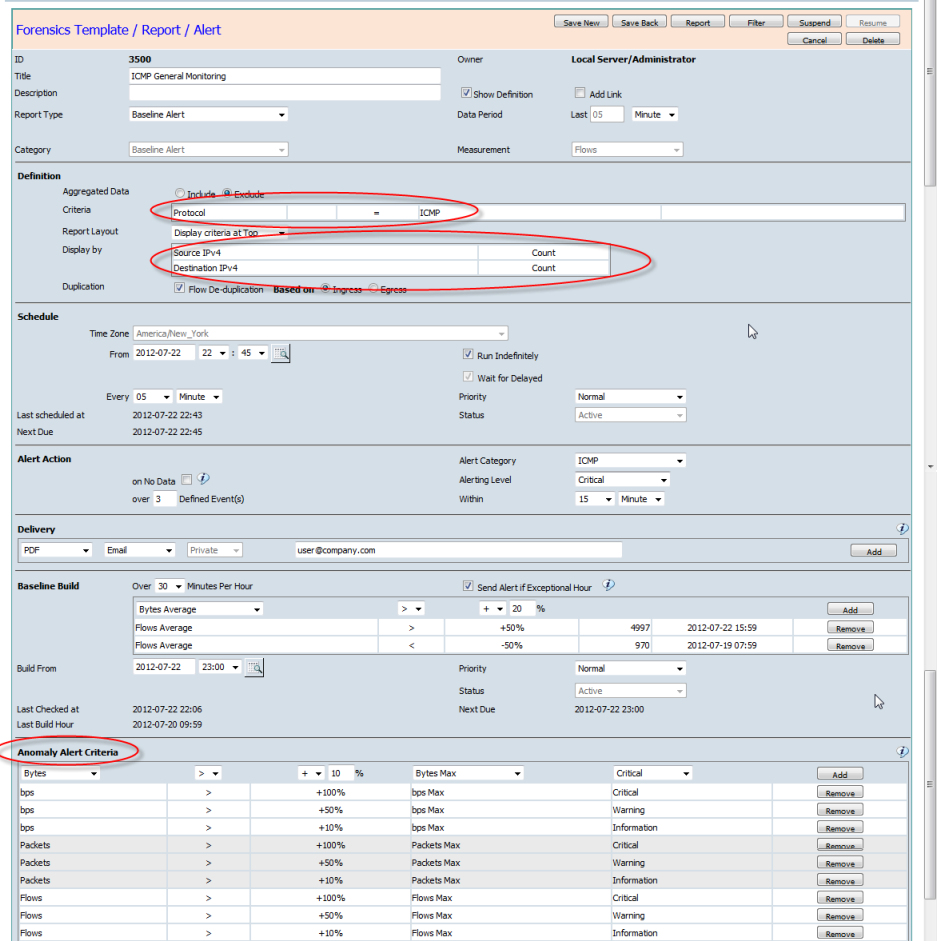
The time fields like Year, Month, Day, Weekday, Hour, Minute are not allowed to be in criteria when Forensics is saved as a Alert